Monday, November 30, 2009
AAPL & AMZN - STRONG HOLDS
Since the month of March AAPL has been moving up very strongly along its up trending channel, always remaining above its 50 day MA, which still holds as its major support level. Since March AAPL has moved from around $85 to close to $205 today, providing a return of 141% in roughly 8 months. AAPL is a slow moving stock providing stable returns and which I consider one of the best stocks out there for investors (not traders). AAPL is currently and has been for the last 8 months a STRONG HOLD.
AMZN - STRONG HOLD
Ever since giving my BUY SIGNAL on AMZN on October 24th, after making a big intra-day jump of around +30% from around $93 to $120, AMZN has now reached yet another all time high at over $136. This would have provided you a decent return of around +13.33% in about a month. AMZN is a slow moving stock in a very strong up trend which is the ideal type of stock along with AAPL for BUY & HOLD investors, who don't want to worry too much about intra-day moves. With all that being said AMZN is a STRONG HOLD as long as this trend persists.
EBAY - Crosses over its 50 day MA
Today EBAY made a sharp move up while crossing sharply over its 50 day MA, giving us a BUY SIGNAL. However EBAY now stands just below its resistance level of around $24.50. A move above $24.50-$24.75 could send EBAY as high as $25.50 before meeting some more resistance. A move above $25.50 would give us a STRONG BUY SIGNAL as EBAY would be trading over its 52 week high and therefore have little resistance preventing it from moving much higher. If EBAY starts pulling back tomorrow, it may simply continue to trend up along its up trending channel which currently is between $23.25 and $24.75. However with this BUY SIGNAL I wouldn't expect EBAY to fall lower than at its 50 day MA around $23.75. EBAY is now also in a SAFE BUY ZONE at $24.50. Its current support level stands at its 50 day MA around $23.75. So taking a long position at $24.50 with stop loss order below the 50 day MA of around $23.50 would have you risk only -4.08% in the event of a reversal, thus giving us a SELL SIGNAL. If you believe that EBAY may just continue to trend up along its channel you could increase your stop loss to around let's say $23.15 which would still have you risk only about -5.51%. This is the advantage of taking long position into SAFE BUY ZONES since you don't need to see your stock go too low and take on a big loss to get a clear SELL SIGNAL. EBAY is relatively a slow moving stock with several intra-day moves of just under +/- 1%, and that is why today's gain of around +5.60% is very significant.
Thursday, November 26, 2009
MGM, Dow Jones, NYSE - Sell Off Coming Tomorrow?
As you may have noticed today all world markets fell sharply lower with the announcement that Dubai World asked creditors for a standstill agreement on its massive $60 billion debt, sparking fears of default which exposes many banks in the world to more bad debt. Dubai World is one of the worlds biggest companies in terms of the amount of investments they make. They are in a partnership with MGM for which it owns 50% of it. Although MGM claims Dubai World has already fulfilled all of its commitments to funding City Center, I think it's fair to expect MGM potential face a big sell off as it also is just below a critical resistance level below the 50 day MA. If MGM does fall hard and below $10.00 it could fall as low as $8.00 to its strongest support level at its 200 day MA around $8.00.
Dow Jones
As I write this, the Dow Jone's futures are at -181 points, and based on the sell offs of all world markets today the Dow Jones could potentially experience a sell of -200 to -350 points tomorrow. Please note that this is pure speculation and these numbers are solely estimated based on today's average world market sell offs. The Dow Jones has the potential tomorrow to very quickly get back down close to its 50 day MA around 10,000. However, if we do get such a big one day fall an imminent STRONG SELL SIGNAL could occur in the event where the Dow Jones were to fall sharply by next week below the 50 day MA. On the other hand after falling off hard to the 50 day MA, the Dow Jones could simply bounce back up and continue back up along its major up trend.
NYSE
I decided to take a look at the chart of the NYSE which may be more relevant to where the market is or may be heading in comparison to the Dow Jones. My first impression by looking at the NYSE is that it is not looking as bullish as the Dow Jones. Despite also being in a strong up trend, the NYSE is starting to giving signs of a slow down in the uptrend and looks to be starting to trend lower. One big warning sign is what looks like a potential head & shoulders or triple top formation. Such formations cannot be confirmed until it moves below the neck, as on a few occasions it does continue higher and never fall below the neck. With that being said never act on anticipation. The moment it does cross down below the neck a target of the height of the head & shoulders is associated with the fall. By looking at the NYSE chart, a sharp fall below the neckline which stands around 6750 could send the NYSE back around 6000. There is some minor support also at 6500 and 6250 but I wouldn't expect them to hold after a fall below 6750. A fall back below 6000, below the 200 day MA could signal the start of a double dip recession that some analysts fear, and at this point it's hard to say where we may be heading, but I think another major crisis would be required to cause such a dramatic fall. With all that being said, we cannot assume than any of this will happen but only if it does fall off these critical levels how low it could fall.
Dow Jones - 2007
Please note that back in 2007 we could observe a head & shoulders formation with the Dow Jones which signaled the top and was then followed by the major sell off and recession.
Please note that I am not saying that any of this will happen, especially since we are a bit from these strong support levels. However, with a potential sell off tomorrow which may only be a one day effect, I felt that it would be important to point out to everyone what could potentially happen if this was more than just a one day sell off, and at what levels do the markets have to hold up to avoid a major move back down. As things stand right now, in terms of the Dow Jones the chart still looks very bullish and until any break downs happen, we have to assume that the up trend will continue and is currently still intact.
Wednesday, November 25, 2009
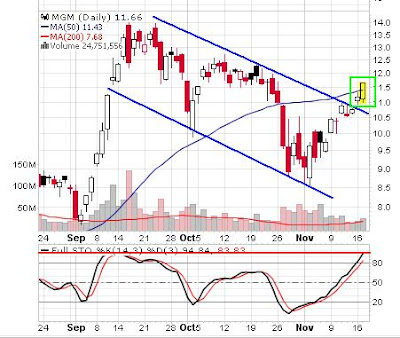
MGM - Heading back up?
Although MGM had broken up over its major up trend since about 2 weeks ago while it was trending in a minor up trend, this minor up trend was broken last Thursday. Since breaking over the 50 day MA it has remained under and is now trending down along the past upper down trending blue channel line. Despite all that, MGM did give us a hammer shaped bar yesterday, which is usually a bottom signal for the current trend. However, it is too early to say if today's move back up means that MGM will now continue higher or continue trending down along the upper blue channel line and below the 50 day MA. To give us a clear BUY SIGNAL, MGM needs to do 3 things. The first thing happened today which is bouncing back up after the hammer formation, the second requirement is for MGM to clearly break up over the 50 day MA, and the third requirement is for MGM to break up over $12.00 and hold up for two sessions. With all that being said, MGM is a WAIT for these events to occur.
Tuesday, November 24, 2009
GOLD - Gold Rush
GOLD is continuing its drive higher hitting all time highs. When GOLD broke over $1125 it gave us a STRONG BUY SIGNAL with an accelerated move higher. GOLD which was already in a strong and steady up trend, is now trading even higher at a faster pace and within a new up trending channel. It is very hard to say where this could stop as it continues to hit all time highs, meaning that there is no resistance preventing it to go higher until the market decides to pull back. One may assume like I did in my November 9th analysis that GOLD could go as high as $1200 before meeting some resistance. Aside from technical analysis, going over round numbers is always psychological factor to go over. One example would be the struggle to go over 10000 with the Dow Jones. In terms of GOLD ever since it broke over this psychological $1000 level has flown much higher as you can see. At this time GOLD has 4-5 very strong support levels. The first one is the lower yellow channel line; the second is the upper blue channel line; the third is the bottom blue channel line, and the fourth and fifth are the 50 day and 200 day MA. Basically, for GOLD to fall off this very strong up trend it would have to fall sharply below these 5 strong support levels. Obviously, this is something I don't foresee for the near future, as I see GOLD going higher at least for a year or more. Like many analysts I am very bullish towards GOLD in the long term, and this will very likely go much higher. However, everyone should be careful as the short move higher at least could be led by euphoria which may be driving GOLD higher. Like some analysts fear, this could be a bubble, but the reason I think this has still more upside is the fact that the market is really starting to take notice of GOLD now, and the price may be driven by a lot of investors looking to get in on the action. In the end you may have so many people into GOLD that this potential bubble could burst. The move higher of GOLD could also continue as long as the U.S economy continues to struggle to recover. For the short term GOLD is a HOLD, for the long term a STRONG BUY. GOLD is in a major uptrend and obviously despite a few pull backs here and there, the overall tendency is to move higher. For the short term I think you should look at GOLD, $100 move at a time. What I mean by this is that if you see GOLD go over $1200, you can expect to see it easily go to $1300, and if it still moves higher $1400 would be the next stop, and so on. Like mentioned before GOLD has no resistance on a technical point of view, and the only resistance are the psychological factors.
EXPE - In a Strong Uptrend
EXPE has been in a strong uptrend for just over 2 weeks, and has last given us a BUY SIGNAL last Tuesday when it made a strong move over its 50 day MA and held up since. Today, EXPE had a small breakout while closing at the upper line of its up trending channel sitting just below its next resistance level of $26.00. As long as EXPE continues to trade within this strong upward channel, EXPE is a HOLD. A move over $26.00 should have EXPE move as high as around $27.00 before getting through some more resistance. A long position around current levels should be relatively safe with the strongest support sitting at the 50 day MA at $24.50. A long position at the current price of $25.75 with a suggested stop loss order of around $24.35 would trigger a loss of only -5.43% to get a clear STRONG SELL SIGNAL. If a pullback were to occur tomorrow it shouldn't be lower than $25.00 where the bottom line of the channel. A conflicting signal though, is the stochastic that looks to being very close of giving us a SELL SIGNAL, which may hint that EXPE may be near the top of its trend. However, today's breakout leaves to me to believe that it may still have a bit of upside left in it. Despite being in a SAFE BUY ZONE, the main challenge for EXPE if it does continue higher would be to go over $27.00 because it pulls back around $27.00 this would give you a minor return of just around +4.85% which is less than you would be risking with a stop loss order around $24.35. However, if EXPE does continue higher than $27.00 it could go at that time much higher. With all that being said and all the conflicting signals that come with EXPE, it is a HOLD.
Monday, November 23, 2009
Dow Jones - Minor Uptrend within Major Uptrend
After bouncing off the 10300 support level and rallying almost as high as 10500, the Dow Jones now looks to be currently trading in a minor uptrend within the major uptrend. The Dow Jones will now be a HOLD as long as this minor uptrend persists, whose support level is indicated by the middle line in the chart. A fall below this middle support line would then give us a SELL SIGNAL. However, the Dow Jones still has relatively good support within each 100 points fall at 10200, 10100, and 10000. Even with a SELL SIGNAL, all this would suggest is to start taking your profits from long positions. There are very little to no opportunities on the short side. What I have concluded is that within a major uptrend it is too risky to take short position, because obviously the major tendency is to go up. It's not worth taking the risk of short position to achieve potential minor returns of around -7% on the pull back, assuming you take it at the right time. The best thing would be to wait for a bounce back up and thus a BUY SIGNAL to then get back. As the Dow Jones continues strongly higher, you should hold on while locking in gains at the same time through trailing or simple stop loss orders. For tomorrow, you can expect perhaps a small pullback within this minor up trend. However, if the Dow Jones moves again strongly higher around let's say 10600, this would possibly be a STRONG BUY signal, but a very cautious one . What I fear from this rally, is seeing it followed by a sharp fall thereafter. For now you should HOLD on, and even if there is a bit of euphoria in the market, as long as it goes up you should stay in, but always protect yourself with stop loss orders. If you want a very good hint to somewhat have an idea whether the market will be up or not in the following session, you should look at the GOLD futures which is mostly driving this market higher. I have found lately that the GOLD futures seem much more predictive than the market futures because GOLD has been very positively correlated to the market in general. The reason is that when GOLD goes up this simply means that the US Dollar is down and therefore the market has to go up to compensate for the lower valued US dollar. You can check out streaming GOLD futures in the following site 24/7: http://www.usagold.com/live.html. After seeing the GOLD futures up strong last night over $1160, I was very confident in seeing the Dow Jones or the market in general move strongly higher today.
Sunday, November 22, 2009
HGSI - Moving Sideways
HGSI is currently trading sideways between $26.00 and $29.00. On Friday, HGSI bounced back up $26.00 which may be a sign that it's now heading back towards $29.00. Another up day would give us a short-term BUY SIGNAL with the minor down trend being broken. However, it is possible to see HGSI continue to trade within this range for a while. To get a STRONG BUY SIGNAL, HGSI needs to move up sharply and close over $29.00. A fall below $26.00 would give us a SELL SIGNAL, at which time it could easily send HGSI towards $23.00-$24.00. The last strongest support level would be at the 50 day MA standing currently at $22.00. Despite the bounce back up on Friday, the MACD which is usually a very reliable long term indicator gave us a SELL SIGNAL, and that's one reason to be cautious before taking a long position and WAIT for a clear signal. Please note that we can also currently observe a flag formation which would be confirmed if HGSI jumped over $29.00 which could then go much higher. A move over $29.00 would give us a price target of $29.00+$5.00= $34.00 which is based on the length of the current pole ($29.00-$24.00=+$5.00). The opposite is also possible with a break below $26.00 which could send HGSI towards $22.00-$21.00. Most of the time a flag formation in an up trend will break up but there is always chanced of seeing the opposite occur. Basically, we're having conflicting signals, and that's why it's better to WAIT.
Friday, November 20, 2009
IRE - Imminent BUY SIGNAL or SELL SIGNAL
Ever since hitting a top at $13.00, IRE broke its up trending channel and has now been trading in a down trending channel line. IRE is now standing at a relatively strong support level at around $10.00, while also being just under the top channel line. Therefore, IRE could now give us an imminent BUY SIGNAL or SELL SIGNAL. To get A BUY SIGNAL, IRE needs to bounce back up strongly over $10.00 and therefore at the same time break up over its down trending channel. A sharp move below $10.00, would give us a SELL SIGNAL at which time IRE's next strong support level would be at $9.00 where the 200 day MA stands. A move below the 200 day MA would give us a STRONG SELL SIGNAL.
LVS - Three Black Crows
LVS has just given us 3 consecutive SELL SIGNALS ever since topping around $18.00 on Wednesday. First, on Wednesday we had a Dark Cloud formation which indicates a top after giving up most of the previous session's gains while hitting a high with the up trending channel line. On Thursday that observation was confirmed while giving us a 2nd SELL SIGNAL by crossing down sharply below its up trending channel line. The 50 day MA which is a zone for which LVS could have bounced back up as it represents a support level was crossed while LVS did manage to close just above it. However, the damage was done and trading below the 50 day MA despite closing above it did weaken the chance of seeing a bounce back up. In fact, today, Friday, LVS gave us a third consecutive SELL SIGNAL with not only giving us a Three Black Crows formation with three consecutive days of trading with lower highs and lower lows, but also by closing sharply below the 50 day MA. Now LVS stands almost exactly at its support level of $16.00 for which it could bounce back up from. A sharp fall below $16.00 would very likely send LVS back in its major down trending channel, which would then give us a STRONG SELL SIGNAL. The Three Black Crows formations increases the chances of seeing a 4th down day on Monday. To get a BUY SIGNAL from LVS, it would first need to bounce back up $16.00, but also to close above the 50 day MA, and stay above it for two consecutive sessions. A STRONG BUY SIGNAL would be given with a sharp move and close above $18.50, towards $19.00.
MPEL - In a Major Down Trend
Ever since topping at $8.50 at the end of October, MPEL has given us 3 consecutive SELL SIGNALS with the first one being around when the price closed just over $7.00 breaking its up trending channel line. Since then MPEL is now still trading with a major down trending channel. MPEL is currently a WAIT, and needs to break sharply above its down trending channel line to give us a BUY SIGNAL. This could possibly coincide with a break back up the 200 day MA as well, which now also represents another obstacle/resistance level to go above. Within the minor trend inside this major down trend, you could see a bounce back up towards just below $5.00. So this depends on what is your time horizon. However, I strongly suggest to never go against the major trend. You want to take long positions with stocks for which the major trend is up, and perhaps short positions with major down trends. Though I strongly suggest to WAIT for now, as the down trending channel line has been in motion for a while now, and the share price just bounced back up, but it could still continue trending down.
Special Announcement - Elimination of BUY CONFIRMED & SELL CONFIRMED
I came to the conclusion that BUY CONFIRMED and SELL CONFIRMED should be eliminated after watching how MGM moved between yesterday and today. MGM gave us a SELL SIGNAL yesterday, and today the stock price moved lower again confirming my observation but it also stopped near a support level at which it may bounce back up from. Therefore MGM is now a WAIT, on the long side perspective. I feel it would be wrong to say MGM is a SELL CONFIRMED since it could always bounce back up from here; this is just a confirmation of my previous observation and SELL SIGNAL. Basically if you decide to act on signals I may give, it should be when I give a BUY SIGNAL or a SELL SIGNAL. Acting after the signals have been given could for some high beta stocks mean that the opportunity may already be gone. However, you can pull your own conclusion from my detailed analysis to see if it's still worth it or not take a position. Keep in mind that obviously some signals fail and other succeed. The reason I don't want to continue to say stocks are either a BUY CONFIRMED or a SELL CONFIRMED is simply because I cannot keep track of all the signals I give every day and therefore cannot confirm every observation. It is possible that some people were waiting for me to give confirmations when I didn't while the signal did succeed, and they might therefore missed an opportunity. Basically when I give a BUY SIGNAL or a SELL SIGNAL it's for you to decide based on my analysis if you want to act on it or not, or move on to something else.
Note: A WAIT signal would be the equivalent of a HOLD for traders taking short positions, but to not confuse everyone I always post my signals based on the long side perspective.
Long Side Perspective:
BUY CONFIRMED => HOLD
When I will be giving a HOLD signal this simply means that we already had a BUY SIGNAL for which the trend is still intact. In some cases you could still a long positions, in others it may be more risky but it's for you to judge based on my analysis.
SELL CONFIRMED => WAIT
When I give a WAIT signal this means that you should wait for the next BUY SIGNAL, or that a SELL SIGNAL has already previously been given. In some cases we could get 2 or more consecutive SELL SIGNAL. In other cases a WAIT may just mean that the trend is not clear and the stock may possibly be moving sideways, and therefore we are waiting for a BUY SIGNAL or SELL SIGNAL.
Thursday, November 19, 2009
F & FAS - Quick Updates
F has now given us a SELL SIGNAL after closing lower today and yesterday despite hitting a 52 week high. F has support at $8.50, $8.25, and strong support $7.75-$8.00. The stochastic has also given us a SELL SIGNAL today. If F does continue lower and falls below $8.50 in the upcoming session, this simply means that F has the potential to fall as low as around $7.75-$8.00 before bouncing back up.
FAS - SELL SIGNAL
FAS today gave us a SELL SIGNAL despite an imminent BUY SIGNAL indicated yesterday it did not happen, and the possible pennant formation failed, and broke down. I indicated yesterday that FAS was a WAIT because it was just below its 50 day MA for which it did not manage to break above and instead pulled back down. FAS has minor support at $72.50 but like I mentioned yesterday it has much more potential of falling back again around $65.00. You can now see why you should not ever take on a position anticipating a move up such as a possible BUY SIGNAL which would have occurred with a break up and a possible pennant confirmation which did not happen. Positions should be taken after a stock price breaks above a resistance level not before when it's trading just below it as it has as much chance if not more of pulling back down like it did today.
ABX - Possible Diamond Top Formation
Despite closing higher today, ABX is now looking like it could possibly be forming a Diamond Top Formation. Although it may be a little early to say, that is why I'm giving ABX a WAIT signal. It did trade as low as $42.66 and bounced back up to close higher at $44.34, but it is still below yesterday's 52 week high. A Diamond Top Formation is one of the hardest pattern to observe and in the case of ABX it is also at the same time trading in an up trending channel which could be contradictory. Basically, I cannot pull a conclusion based on the current observation. A fall below the downward trend line would break the channel line, but if a Diamond Formation happens it could still bounce back up the next time it hits $42.00 where it has support. ABX could continue to trade between $42.00 and below $45.00 for the next few sessions, and as long as the closing price stays below the 52 week high, the formation could still be valid. Also Gold has hit yesterday the level of 1150 for which I expected to hit before it could possibly pull back. This would coincide with a possible pull back from the Dow Jones also, which have been very positively correlated for the last few months. Again, for now ABX is a WAIT as it's too early to say if this is indeed a Diamond Top Formation or a continuation of the up trending channel line.
MGM - Breaks Down
After announcing MGM was a STRONG BUY CONFIRMED after staying above its 50 day MA for a 2nd straight session, I believe I misread that. Although MGM did close for 2 straight sessions above the 50 day MA, it only stayed above it yesterday only. What I mean by this is that despite closing above the 50 day MA on Tuesday, it did trade below it during that day. To actually have a STRONG BUY CONFIRMED which I mistakenly gave yesterday. MGM would have needed to trade above the 50 day MA again today which it obviously failed to do. Although MGM fell hard today, it was indeed in a SAFE BUY ZONE. Like I mentioned yesterday, a fall below $11.50 only was required for MGM to get a SELL SIGNAL. In fact after crossing down the 50 day MA below $11.50, MGM fell as low as $10.86 before bouncing back up above its support level of $11.00 and close at $11.23 while still remaining below the 50 day MA. If you would have taken a long position yesterday at the closing price of $11.84 and set a stop loss order of around $11.40 below the 50 day MA level of $11.50, you would have taken a loss of only -3.71%, rather than find yourself in a loss of as low as -8.27% according to today's low of $10.86. This shows again how important it is to always set stop losses for all your stocks after you take a long position. As you can see for my long position I avoided a much bigger loss than I could have suffered from without a stop loss, and instead took on a minor loss. Today's move of MGM was a perfect example of what is meant by my SAFE BUY ZONE signals. A SAFE BUY ZONE doesn't mean the price will start moving higher from here because of strong support but rather that a short fall would be required for it to give us a SELL SIGNAL and potentially move lower like it did today with MGM. The stochastic has also given us a SELL SIGNAL today with a cross below the signal line.
Now where could MGM go from here? Right now, it's a little early to say, but MGM could start trading sideways, while flirting with the 50 day MA like it did in the last 3 sessions including today. However, MGM did break its up trending channel line today while remaining above the major down trending channel line. If MGM does not manage to hold above the $11.00 level, its next support is at $10.50. A move below $10.50 could potentially give us a STRONG SELL SIGNAL with the risk of falling back into its previous major down trending channel. To get a BUY SIGNAL again from MGM, it now needs to not only manage to trade above the 50 day MA for two straight sessions but also to cross sharply and close above the $12.00 level. For those like myself who were already long MGM, selling is probably the best option to not risking to take on a bigger loss. If you are looking to go long, I would wait for the next BUY SIGNAL.
Dow Jones - Resuming the Trend After All?
After trading slightly above its upward channel trend line, the Dow Jones has failed to give us a STRONG BUY CONFIRMATION, and has now instead pulled back to give us a SELL SIGNAL. Despite, gaining back about half the losses of the day, I believe the damage has been done, and the door in now open for the Dow Jones to resume its major trend and could pull back as low as 9900-10000. I think seeing the Dow Jones pullback from here and resume its trend is healthier for the market and will allow it to make a more stable and sustainable gain for the longer term. To get a SELL CONFIRMATION, another day of losses tomorrow should be enough. However, the clearest signal would be if the Dow Jones hit a lower high and a lower low. It currently has minor support around 10300 and 10200 from where it bounced back up today, but I don't see it hold up for long. After the 10200 level there is not much more support and it could then easily fall to the 9900-10000 level I've mentioned. A down day tomorrow will also give us a SELL SIGNAL from the Stochastic which is in heavily overbought territory at just over 96 for the signal line. However, I wouldn't be surprised to see the Dow Jones trade slightly upward tomorrow since the market is in a major up trend, and each pull back are now often see as opportunities to get in at cheaper prices. However, I believe the damage has been done and any attempt to recover should fail, this is a common pattern. For now I would avoid taking long positions, and would actually start to close my long positions and cash in your gains if you have some. For my part I did have some of my stop losses triggered for which I obviously took on losses and for another stock I just closed the position rather than wait for its stop loss to be triggered. At this time there is now much more potential of seeing the market move lower in the short term. Based on the last 3-4 pullbacks of this major up trend, the pullbacks durations seem to have lengthen due to the bigger moves that were achieved after each bounces back up. The first two pullbacks lasted about a week, while the last two lasted around 2 weeks. Basically the duration of the pullbacks have been on an increasing trend, and therefore this current potential pullback if it does get confirmed could last 2-3 weeks, but that's just speculation. There is always the possibility of seeing the Dow Jones break the trend and continue even lower, however I highly doubt this. Although I don't see many opportunities for significant gains on the short side, there are still currently more than on the long side, assuming the SELL SIGNAL gets confirmed.
Wednesday, November 18, 2009
ABX - Dark Cloud
Despite GOLD continuing to move higher, ABX and most Gold stocks were down today. ABX gave us a SELL SIGNAL with a Dark Cloud formation today. However, ABX is still trading within its up trending channel. This means that tomorrow is a critical day for ABX. A move down below $43.00 would break the channel trend and give us another SELL SIGNAL. I did consider selling my position pre-maturely today at a loss, however the fact that ABX also has support at $43.00 made me hold on for now. If ABX does fall below $43.00 tomorrow my stop loss order will get triggered. If you are looking to take a long position in ABX, you should wait and see tomorrow if the price bounces back up and continues to trade within this channel. The SAFE BUY ZONE simply means that ABX does not need to fall off the average -7% stop loss order that you should set to get a SELL ORDER, meaning that you would take on a smaller loss than for other stocks in average. ABX would need to trade around $44.50 and above tomorrow for it to stay up within its up trending channel. So, if the price does bounce back up to this level or higher, it would then be safe again to enter into a position. If you do, make sure to set a Stop Loss order below the lower channel line, which would then be around $44.50. ABX is a WAIT with an imminent SELL SIGNAL.
ABX - LONG
FAS - Pennant Formation within a Broadening Trend
Since the month of August, FAS's trend has been broadening with increased volatility. FAS has hit higher highs while always falling back to the same level of $65.00 where it bounced back up strongly and created strong support. Towards the end of October FAS crossed sharply below its 50 day MA, however it does not seem to be very significant in this case, as it seems to continue to follow its major broadening trend. Now, FAS is standing just below its 50 day MA at $80.00. A sharp move above it around $81.00-$82.00 should be enough for it to give us a BUY SIGNAL. At that time you may see this broadening trend continue and see FAS hit $95.00 or hit a higher high once again, before possibly pulling back again. To add further fuel to this imminent BUY SIGNAL, we have a pennant formation with the pole going from $65.00 to $80.00. A break above $80.00 would give us a BUY SIGNAL and a price target of $95.00 if not higher ($80.00-$65.00= +$15.00 ==> $80.00+$15.00= $95.00). Until FAS breaks above $80.00 it is a WAIT. Taking a position prior to a move above $80.00 would be very risky as there is very little support until the $65.00 level.
F - Driving Up
Ford has been driving up strongly within a channel line for the past 2 weeks and is now at a critical resistance level at $9.00. Although, F did slightly move above this level today at $9.14, but it did not maintain the gains and closed lower at $8.94. Another move lower tomorrow would give us a SELL SIGNAL, and a break below the lower up trending channel line would give us a SELL CONFIRMED. F has minor support at $8.50, but a sharp fall below $9.00 could send F back to $8.00 where it has strong support. On the other hand, seeing F move back up strongly and close above $9.00, ideally at least around $9.25, this would give us a BUY SIGNAL. A 2nd up day or session holding up above $9.00 would give us a BUY CONFIRMED. Right now F is still trading within its up trending channel line and is therefore a HOLD. Today's move signifies indecision, and F is now standing around its critical $9.00 resistance level, and that's why a BUY or SELL SIGNAL is imminent.
MGM - Moves up and stays above its 50 day MA
Today MGM moved to as high as $12.15 before pulling back but still closing up at $11.87. MGM is now a STRONG BUY CONFIRMED since it managed to continue to move higher and remain above its 50 day MA without touching price points below it. Anyone taking positions from this level should set stop losses below the 50 day MA which currently stands at $11.50. For my part today, I had set a $0.25 VTSO for MGM which got triggered and sold my position at $11.90, cashing in an approximate gain of +7.00% in 2 days. However, after seeing the price move lower while staying above the 50 day MA I re-entered into a new position at $11.77. The purpose in doing this is that I did not want to risk more profits than I already had, and in fact this allowed me to re-enter into a new position at a lower price point that I sold off my last position. It's important to lock in gains when you have them, but obviously it's easier to do so when you have access to VTSO like I do, rather than having to adjust manually your Stop Loss orders. I consider MGM to not only be a STRONG BUY CONFIRMED but also to be in a SAFE BUY ZONE. The reason I believe this is because MGM's closest support level appears to at its 50 day MA at $11.50. Therefore if you take a position at the current price of $11.87 and set a Stop Loss order below $11.50 of let's say $11.40, you would only be risking -3.95% before having a SELL SIGNAL. This leaves you more room to wait and see if MGM goes even lower to have a more robust SELL CONFIRMATION, without losing more than -7% or -8% which I believe wouldn't be necessary to take on. For my part I have set a Stop Loss order just below the 50 day MA, as I don't believe it to be necessary to wait and see fall down more and lose more money to get a clear SELL SIGNAL. In fact if it does fall back below the 50 day MA, you can expect MGM to fall back to $11.00 or $10.50 before having any significant support. With that being said it would be smarter to sell before and get back in when the price bounces back up. If the price does continue higher MGM's next resistance levels are at $12.50, $13.00, and $13.75-$14.00.
MGM - LONG
Dow Jones - Keep leaning back above 10400
Despite staying above its channel up trending line for a third consecutive session, the Dow Jones has not made a significant move up since to have a STRONG BUY CONFIRMED. A positive sign is despite the Dow Jones falling back below 10400 for the last few sessions it has managed to gain back most of the gains at the close to stay above 10400. This seems to confirm my previous observation that the 10400 level is now becoming a support level for the Dow Jones. At the same time the Dow Jones still hasn't managed to go above the 10500 resistance level, and therefore it is currently trading in tight range around 10350 and 10450. As long as the Dow Jones continues to move slightly up above the up trending line, the Dow Jones may be considered a cautious BUY but not a STRONG BUY yet.
NFLX - Looking back over my prediction
On November 5th, I pointed out that NFLX had a pennant formation that would give us a BUY CONFIRMED if the price went over $57.00. This actually happen 2 sessions later, and since then NFLX has continued to move up strongly along its major up trend. Obviously, I cannot keep track of all stocks for which I make predictions for and cannot always signal BUY CONFIRMED when they do occur. But if you had read my analysis then you would have needed me to do so as I indicated in the analysis itself that NFLX needed to go over $57.00 to get the BUY CONFIRMED. What I will try to do at the end of each month if time allows it, is look back to all the month's predictions and see where the stock moved since.
Here is the chart of my November 5th prediction:
Here is today's chart:
Based on the pennant formation that was confirmed, I have set a price target of $66.00 for NFLX, which is what I would consider the fair value for NFLX before the up trend may start settling down. This doesn't mean the price can't go higher, but simply what price point it may have tendency to go back to. This is what we call a negative feedback, which is a reversion to the mean, something I've seen happen on a few occassions with pennant formations. NFLX is currently a HOLD. Taking a position in NFLX now may provide with a certain return, but NFLX may not have too much fuel left in it to drive much higher. Basically, to make big returns you need to catch trends early and would have had to buy on the BUY SIGNAL or CONFIRMATION. However, NFLX is trading within a strong up trending channel and you could try to ride it as long as it holds.
Tuesday, November 17, 2009
CBY - Bidding War
Just a couple days ago, Kraft expressed its attention of conducting a hostile takeover of Cadbury. This caused the stock to jump and break the narrow channel line in which CBY has been trading in during the last 2 months. Today, it is reported that Ferrero and Hershey wants to compete and place a joint bid for CBY to prevent its competitor Kraft of taking over the company themselves. This is what is driving CBY up trend right now. As long those reports persists and those companies actually do attempt to take over CBY you can expect the price to move higher. CBY which has now given us a BUY SIGNAL in a SAFE BUY ZONE. This means that if you were take a position at the current price of $54.00 you would only need to set a stop loss order below $52.00 to get a SELL SIGNAL (~-4%). As things stand right now CBY is riding up its 50 day MA. The MACD has also given us a BUY SIGNAL today, while the Stochastic is in overbought territory, but may not be very relevant at this time.
ABX - Won't Go Down
Despite giving us a few SELL SIGNALS a few sessions ago, ABX won't go down, and is continuing to move strongly higher. With GOLD moving higher all Gold stocks have rallied, but ABX is outperforming the rest. ABX is in a very strong up trending channel and despite being in overbought territory in terms of the Stochastic it has give us another BUY SIGNAL. ABX is consistently hitting new 52 week highs, and according to the 3 year chart ABX has the potential to go as high as $49 and $53 before seeing any strong resistance (levels not seen since 2007-2008). Taking a position around $45.00 should be relatively safe as it appears to have relatively good support now at $44.00, $43.00 and $42.00. This means that taking a position at $45.00 while being willing to take on a risk as high as -7% or -8% has little chance of being triggered and perhaps don't need to go as low to give us a clear SELL SIGNAL. If ABX were to break its up trending channel line, it would only need to go and close towards $43.00 tomorrow for a clear SELL SIGNAL. With all that being said ABX can be considered to be in a SAFE BUY ZONE. Despite selling my ABX position around $42.00-$43.00 just last week, I have now taken on a new position seeing now the potential for ABX to continue higher. I had sold ABX last week because I did not want to risk more gains that I wanted to, and the up trending channel line was narrower then. This is the whole purpose of my Y-Swing 3.0 strategy; locking in gains when you have them and getting back in when it's safe and that trend is more clear. Again, don't forget to set a stop loss order, and with ABX it should be relatively tight, as you don't need to risk as much as -7% or -8%, around -5% from current levels should be enough.
ABX - LONG
MGM - Moves over its 50 day MA
Today, MGM has given us a STRONG BUY SIGNAL after finally breaking up over its 50 day MA. MGM now appears to be starting a strong up trend, after breaking up over its major down trending channel. I have personally added to my MGM position today while setting a tight VTSO for now. To get a STRONG BUY CONFIRMATION, we need to see MGM hold up above its 50 day MA which would make it the new support level. MGM has been trading in a narrow and steady up trending channel since the beginning of the month. However, one possibility is seeing MGM pull back to $11.00 where it also support. This I believe all depends on if the Dow Jones continues higher or not. The stochastic, despite moving steadily higher is at a key resistance level, and we should know very soon if MGM continues higher from here or starts pulling back a bit and possibly building support around $11.50 or $11.00 if it falls back down.
MGM - LONG
Dow Jones - Accelerating the Up Trend
The Dow Jones has given us a STRONG BUY SIGNAL today after holding on to yesterday's gains while hitting a higher high and higher low. For a 2nd straight session the Dow Jones has managed to stay above its up channel trend that hadn't been broken for the last 4 months. The Dow Jones now looks to accelerate its up trend. The top channel line may now become the support level for the Dow Jones, and we may not see the pull back we have gotten use to in the last few months when the stock remained within the channel. Despite the stochastic also giving another BUY SIGNAL, I do advise to be cautious as the Dow Jones is in overbought territory and at strong resistance levels within both the stochastic and the RSI. To confirm this STRONG BUY SIGNAL, I would like to see the Dow Jones make a stronger move higher and get near if not over 10500. The Dow Jones appear to perhaps starting a new trend, which is still up. The Dow Jones has started to built some support at 10400, and seeing the Dow Jones bounce back up from this level (closing higher from it) will reinforce it. Another possibility is to temporarily see the Dow Jones continue steadily and slowly higher along the up trending channel line. A break back down, could be triggered by a sharp move down. I do believe that when we do start getting our next pull back it may happen more quickly and make sharper moves down. With that being said I do advise to be cautious with your long position and locking in gains or protect yourself from big losses by always setting Stop Loss orders. However, as the Dow Jones continues higher you do want to have long positions and not miss out on all the action. However, you have be very careful and do not let greed take over. What I fear from an accelerated move up from the Dow Jones is seeing it followed by a big crash. For now this is pure speculation. However, if the Dow Jones starts for example to move quickly towards 11500-12000 with very little pull backs you want to be very careful and lock in your gains and prepare yourself in the event where you would see a sharp move back down. Basically what I'm saying is as long as the Dow Jones moves higher you want to be long and make as much as you can, but you must never forget to protect yourself with Stop Loss orders. Stop Loss orders are like insurance, and it's free so why would you take the risk of not taking it.
Monday, November 16, 2009
GOLD & Gold Stocks - Continuing to fly high, but for how long?
Gold has now gone as high as $1140 today, and as I announced on November 9th in my post: " $GOLD & ABX - Gold soon pulling back?"
"As GOLD continues to move higher along with the market, I think we can expect a small pullback very soon. This should coincide with the Dow's pullback when it does occur, which I expect to be around 10300-10350. For GOLD if this up trending channel persists, it may go as high as 1150 (maybe close to 1200 but less likely) before pulling back possibly around 1060."
What has now happened is that the Dow Jones is now continuing to move higher along with GOLD for which it has been very positively correlated for the past few months. I expected then to to see the Dow perhaps pullback at 10350 along with GOLD possibly going as high as 10200, however these events did not coincide. I now think that GOLD along with the Dow Jones may be at least temporarily an indication of how high the market may go before pulling back. When the Dow Jones hit 10350, GOLD was still at 10115 and its chart still indicated like it had some more room to move higher before pulling back. Indeed today GOLD is continuing higher, and I think this is what is pushing the Dow Jones higher. GOLD moves up because the US Dollar is going down, and therefore the Dow Jones has to go higher to compensate for the weaker dollar. This is the same reason why OIL is also moving higher. Keep in mind that this may be just a few factors among several others, but significant one's nonetheless. It seems that GOLD stocks still have some up side in them, but I'm not sure it will last again for too long, before it pulls back. You may see GOLD stocks possibly move up to another +10%, but they are all in overbought territory, and I think when and if it gets close 1200, you should watch for a market pullback. Basically if GOLD continues higher so will the market. Keep in mind that despite the fact that I see a GOLD pull back coming soon, I am still very bullish long term towards GOLD and like many analysts I do see it eventually hit $1500 and possibly $2000. Ever since GOLD has sharply crossed over $1000, the door for it to move much higher has been opened.
STP - Solar Energy Stocks Looking Strong
STP along with other solar energy stocks made a strong move up today. STP has not only broken through its major down trend, but also crossed through both its 200 & 50 day MAs. Holding above its 50 day MA around $14.50 would confirm the STRONG BUY SIGNAL. STP will meet resistance at $16.00, $17.00 and $18.00. However, taking a position around current levels of $15.00 and seeing it hold up above its 50 day MA could possibly qualify STP as being in SAFE STRONG BUY ZONE. The reason is that STP would only need to fall back below its 50 day MA towards $14.00 to give us a SELL SIGNAL. Therefore you would only need to take on a small loss of the price reverses immediately from here. The rise in solar energy stocks is related to the fact that the price of OIL is continuing to increase therefore increasing the demand for alternative energies. Most solar energy stocks have given us BUY & STRONG BUY SIGNALS today. However, move cautiously as a sseing the Dow Jones continue higher is required to see these stocks move higher as well. Basically when the market is up, most stocks will be also, but it's just a matter of finding the stocks that will outperform others.
Dow Jones - Sell Signal Fails, possibly heading higher
The Dow's previous SELL SIGNAL has failed. The Dow Jones has started to cross through some strong resistance and may now be heading higher much more quickly. If the Dow Jones gets close to 10500 and over, we will have a STRONG BUY SIGNAL. At this moment what I would accept to see is an acceleration of the current strong up trend, where we could possibly see the Dow Jones move quickly towards perhaps 11000 and 11500. However, I do advise to be careful as if it does indeed move faster upwards, the pullback may be as sharp. The Dow Jones for now is giving us a BUY SIGNAL, possibly becoming a STRONG BUY SIGNAL with any other strong move towards or over 10500. Another possibility is seeing the Dow Jones have a few small pullbacks annd moving sideways with support that is now building at 10300. What may be happening right now is the beginning of a new trend, which for the moment may still be up. However, the current channel for which its been trading in the last few months may now shift to a new trend, which may make things more difficult to predict. We may need to wait a few sessions to really establish where the new support or resistance levels may now be. However, it's too early to say and the Dow Jones could still pull back from here and continue within its channel.
MGM - Possibly a Strong Buy Signal Soon?
MGM has just gone through its critical resistance level of $11.00 to give us a BUY SIGNAL. MGM has finally broken its major down trend and is now standing just below its 50 day MA which stands at $11.50. To confirm the BUY SIGNAL, MGM needs to stay above $11.00 tomorrow. When MGM goes over its 50 day MA, over $11.50 we will have a STRONG BUY SIGNAL. Based on the Stochastic which is heading towards overbought level, I think once MGM goes over its 50 day MA, it may go as high as just under $12.50 where its next resistance level, before pulling back to $11.50. To confirm the STRONG BUY SIGNAL after it goes over $11.50, the price in the following session would have to hold above this level. I think if MGM manages to go over $11.50 and holds up, it will manage to much higher in the near future despite many resistance levels to go through. The point is that if it manages to go over its 50 day MA and the price holds up, there will be a lot of support at $11.50, giving it less chance of falling back below and giving a SELL SIGNAL. I think a strong move up by MGM would probably coincide with the Dow Jones which looks like it could give us STRONG BUY SIGNAL soon. MGM is now looking to start a major up trend. The MACD also gave us a BUY SIGNAL a few sessions ago, which I usually find to be a better indicator for the longer term of the trend. I have now taken a long position with MGM again.
MGM - LONG
Saturday, November 14, 2009
Dow Jones - Bounced Back Up but Trending Lower
Yesterday we saw the Dow Jones bounce back up; however it's started to trend lower. After a sharp down session on Thursday, the Dow Jones did close up on Friday but has hit a lower high, and thus is trending down. We will know for sure next week where this is heading, but assuming the trend continues, the Dow Jones should be heading lower towards 9900-1000. It does have some support at 10100, which if it hits back these levels, I don't expect it to hold. This is only speculation and based on the assumption that this trend that's been going on for the last 4 months continues. The SELL SIGNAL is still valid but not confirmed yet, and we need to see another down session to confirm it. However, like mentioned before there might be some support at 10100, before it moves lower.
Friday, November 13, 2009
New Signal - SAFE BUY ZONE
I have decided to introduce a new signal named the "SAFE BUY ZONE". This is in response to seeing ATVI's chart, which relatively similiar to where ABX was when I took my long position before achieving a return of around +17.00% in just 14 days. SAFE BUY ZONE will be associated with stocks for which taking a long position at the current price would only require you to set a stop loss order that would only make you risk less than -6.00% which is much lower than the average risk you would usually have to take. Obviously such stocks would also require you to have a potential return which is higher than your risk. I have noticed that these stocks usually seem to be between their 200 day and 50 day MA. Here are the charts of both ABX and ATVI who are cases for which you would have a SAFE BUY ZONE. ABX's chart is from October 29th, and ATVI of today November 13th:
ABX (October 29th)
ATVI (November 13th)
ATVI - In Safe Buy Zone
ATVI has a very interesting chart, and actually reminds me of ABX's chart when I had taken my long position. ATVI is currently standing just below $11.75 where it has resistance. ATVI has relatively strong support at around $11.30 above its 200 day MA, despite having crossed below it a couple weeks before crossing back over it again. However, just like when I took my positon with ABX, ATVI is currently is a Safe Buy Zone. This means that ATVI would only need to make a small move downward to give us a SELL SIGNAL, while at the same time only needs a small move up to give us another BUY SIGNAL. ATVI closed today at $11.69, a sharp move above $11.75 above its 50 day MA towards $12.00 would be enough for a BUY SIGNAL and potentially seeing ATVI move higher. A move below $11.25 around $11.15 would be enough for a clear SEL SIGNAL. Basically if you took a position at the current price of $11.69 and set a Stop Loss order at $11.15, you would only be risking -4.6%, with the potential of seeing ATVI providing you a return as high as +11% towards $13.00. Although a potential gain of +11% may not be huge it is relatively good considering a -4.6% risk, and once you start making gains this doesn't mean it can't go higher then. Also, the MACD which I have usually found to give less failed signal than the stochastic had given us a BUY SIGNAL following the move back up the 200 day MA. The stochastic also looks bullish looking to move higher towards the over 80 level, which hints that ATVI has more way to go. When the Dow Jones is starting to trend down, as it is now, it is very hard to find stocks for which look like they could move higher despite the market possibly going down. ATVI may be one of the minority of stocks that could move higher, despite a pull back from the Dow Jones. Some stocks act more independently than other towards the general market direction. What further fuels this possibility is the fact that ATVI closed slightly upwards yesterday, despite seeing the Dow Jones move relatively lower. ATVI has a low Beta of 0.66 and even if ATVI were to follow the market downwards the Beta may indicate it may not move as low as the general market. ATVI has led me to come up with a new signal indicator, named the "Safe Buy Zone", which simply means that going long at the current level would only require to risk less than -6% of your investment (so set a Stop Loss order of less than -6%), with obviously a higher potential return. You may get BUY SIGNALS from stocks but from which you would need to set a relatively high stop loss order.
CAT - Waiting for a Sell Signal?
CAT is currently still in a strong up trend. However, it's very close to crossing down below $58.00 where it would give us a SELL SIGNAL. However, even with a break below $58.00, CAT trend would still be up and CAT seems to be trending within two up trends, with the trend line I crossed and above its 50 day MA. Basically, a cross below $58.00 could send CAT as low as $54.00 where the 50 day MA currently stands. CAT has minor support also at $56.00 but I don't think it would hold up in the event where $58.00 is broken. For the moment CAT remains a HOLD, and I believe if the Dow Jones continues trending lower you will see CAT cross below $58.00. In the event where the Dow Jones would actually start moving higher again and that its SELL SIGNAL failed, you could simply expect CAT to continue upwards along this trend. However, the stochastic has already given us a SELL SIGNAL yesterday, and the MACD is about to also and will if CAT moves lower on Monday. However, remember that technical analysis is not a perfect science and can give false signals, and that is why until CAT stays above $58.00 it remains a HOLD. However, if you are in gains already with CAT, remember that you should never sacrifice too much of what you already accumulated and you may choose to sell before and in the event where CAT bounces back, you can repurchase CAT then. Remember that the goal is to staying in as long as you can when you're making money, but without sacrificing too much when you have it. Basically you want to make your moves when you have clear signals, rather than gamble with your gains. You will never be able buy at the bottom and sell at the peak.
Thursday, November 12, 2009
Note on BUY CONFIRMED
MGM, HGSI, ABX, SBUX, NFLX - Updates
MGM - WAIT
Has not managed to go over $11.00-$11.25 and will not give us a BUY SIGNAL until then. So far MGM pulled back to its support level of $10.50. Falling below $10.50 should send it back to $10.00.
Note: I have sold my position today at $10.60 cashing in my gain of +8.00%, achieved in 7 days.
ABX - SELL CONFIRMED
Now that ABX has fallen again today along with GOLD and the rest of the gold stocks, we now have a SELL CONFIRMED. Since ABX has fallen below its $42.00 support level, it could pullback towards $39.00-$40.00. But I don't see any major pull back for Gold and for the longer term I'm still bullish towards GOLD.
Note: As I announced yesterday my VTSO was set to be triggered between $42.00 and $43.00 and indeed my position was sold at $42.62, cashing in a gain of around +16.00% in 14 days.
HGSI - SELL SIGNAL
Has broken its up trending channel within its potential pennant formation which is no longer valid. Despite a BUY CONFIRMATION yesterday, HGSI is now giving us a SELL SIGNAL along with the market. HGSI could pull back as low as $26 and $24. Keep in mind that despite this SELL SIGNAL, and like most stocks in the market I don't any major pull back occurring. On average from the few charts I've looked at most stocks have the potential of pulling back -7% to -10%. This mostly has to do with the fact that most stocks are in an up trend despite what looks to be like a small pull back coming up.
SBUX - HOLD
SBUX is now a HOLD and has very strong support at $21.50, $21.00, $20.50, and $20.30. Basically if SBUX does pull back along with the market I don't see it fall by too much, assuming the Dow Jones' trend continues and eventually pulls back.
NFLX - SELL SIGNAL
NFLX is still trending up but has given us a Dark Cloud formation, which may indicate it may fall further tomorrow. But again, NFLX has support at $56.00, $54.00, and $52.00.
Dow Jones - The Trend Continues
As I predicted, after getting near 10300-10350, the Dow Jones is now looking to pullback. Another down move tomorrow will give us a SELL CONFIRMED. If the SELL CONFIRMED does occur you can expect the Dow Jones to pullback as low as 9900 or 9850, depending on the speed it occurs. The slower it falls the less lower it will fall. Despite this apparent pullback there seems to be very little opportunities on the short side.
DISCLAIMER
The analysis and information given on this site is for information purposes only. Trading in these strategies may result in capital loss. Individuals should do their own independent research or consult an investment advisor before taking investment action. All materials on this site, including the stock picks, are for news and entertainment purposes only and are provided on an "as is" basis and without warranties of any kind, either express or implied.
Under no circumstances will yoel stockpredictions.blogspot.com be liable for any special or consequential damages that result from the use of, or the inability to use, the materials in this site, even if advised of the possibility of such damages including, but not limited to, negligence. In no event shall yoel-stockpredictions.blogspot.com have liability to you for any damages, and losses for accessing this site or using the information provided.Yoel-stockpredictions.blogspot.com does not guarantee that the information contained herein or distributed from this site will be uninterrupted or error-free, that defects will be corrected. Past Results are not necessarily indicative of future performance.
Yoel-stockpredictions.blogspot.com does not trade against you. Some sites are using the size of their visitors to 'move the market' and take advantage personally with their stock picks. This is illegal, and mostly applicable in smaller less liquid securities, which are not covered on this site. It is highly unlikely that the articles in this site about stock picks could ever move the market.
As a visitor to this site, you acknowledge and agree that any reliance on or use by you of any information available on this site shall be entirely at your own risk. In no event shall yoel-stockpredictions.blogspot.com be liable for any direct, indirect, consequential or exemplary damages arising from the use or the performance of this site, even if will yoel-stockpredictions.blogspot.com has advised of the possibility of such damages. Trading may not be suitable for all visitors of this site or the information provided by this service. The visitors assume the entire cost and risk of any trading they choose to undertake.